 Investor Login

The World is Drowning in Crude Oil
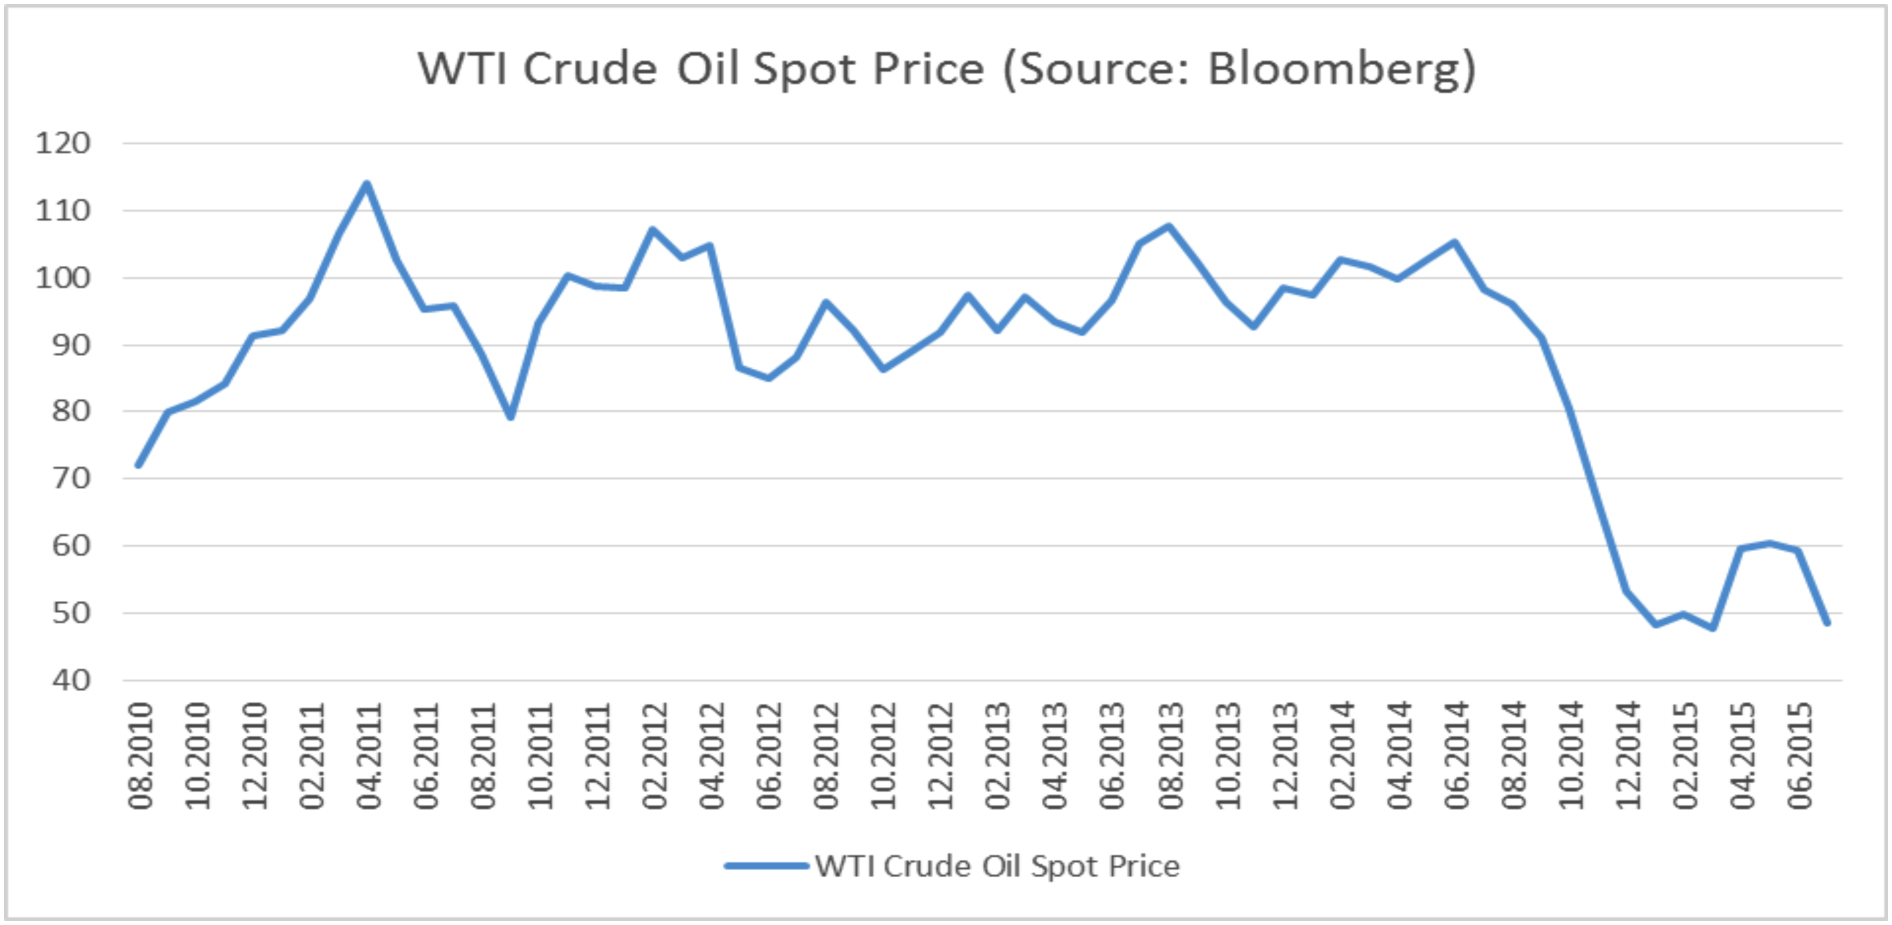
Prices for Crude Oil have dropped dramatically. Just one year ago prices were about twice as high as they are now. For example one barrel of West Texas Intermediate traded in a range between USD 80 and 110 – see chart below. It currently trades below USD 50 per barrel. The picture for North Sea Brent and other global crude oil classes is very similar: prices are dropping.
Background – World Crude Oil Consumption and Production
Currently the world produces and consumes about 94 million barrels crude oil per day! One barrel (bbl) equals 159 litres or 42 US gallons in this case.
The crude oil production world is split into OPEC and non-OPEC countries. The OPEC cartel of 12 countries including Saudi Arabia, Iraq, Iran, Kuwei, UAE, Venezuela as their largest producers controls about 80 percent of global conventional oil reserves while producing just one third of global output. OPEC has proven its pricing power in the 1970s when it cut oil production in response to the Yom Kippur War. Accordingly crude oil prices quadrupled and the word economy entered into a severe recession.
OPEC has had a general consensus since 2012 that oil prices of around $100 a barrels are reasonable and fair.
Consumption varies widely by country and region. It depends on climate, structure of economy, taxations (or even subsidies) and – last but not least – the standard of living. The USA is the largest consumer in the world – using about 20% of global supplies while making up less than 5% of global population. For example Saudi Arabia’s fuel consumption is at 40 barrels per year and per capita while it is 21.8 in USA, about 10 in European Untion and just 1 in India. Since the global average is 5 bbl per capita and year we would need to double global production to lift global average to European levels.
Is there a drop in global consumption that may have led to falling prices?
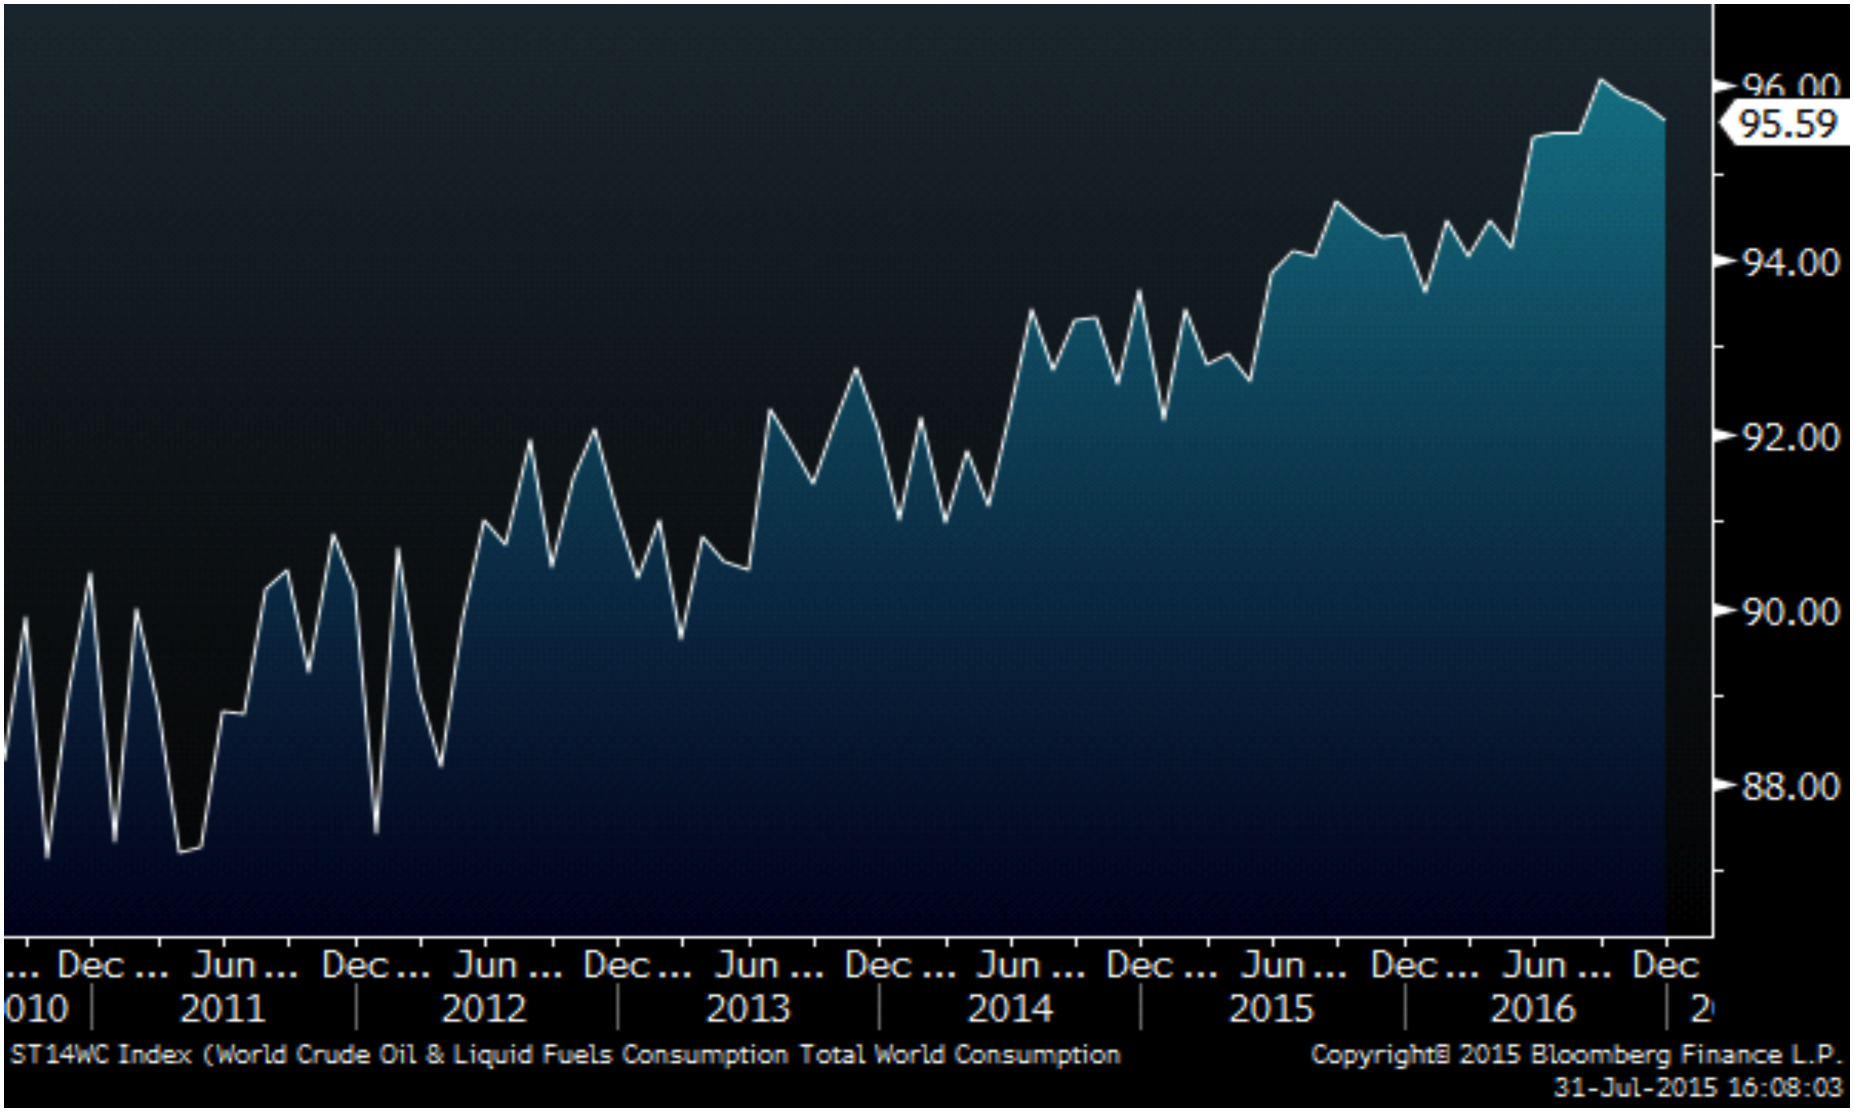
No, consumption is still growing indeed. It grows at a fairly stable rate of about 1% – see chart of total world consumption per day below. By the way – this increase equals roughly the growth rate of world population.
So is there a large production surplus pushing prices?
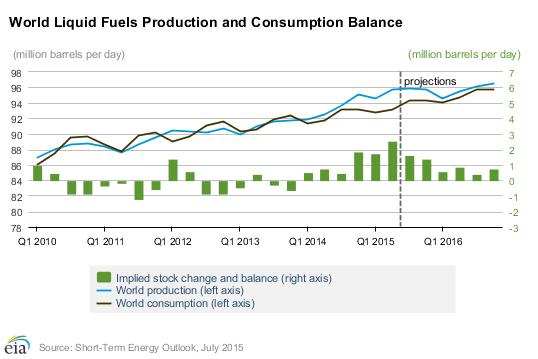
Production is growing too. At first glance it grows at s similar pace as consumption does – see line charts below. However when taking a closer look at the bar charts representing the surplus you can see an increasing number of positive quarters with increasing levels and also positive projections. This surplus makes up about 1-3% of total global market volume.
Can this supply surplus cause such a price drop?
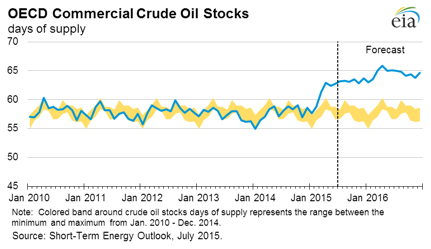
This surplus has to be stored somewhere. Global oil consumer typically store the amount they need for 55-60 days to get through shortages caused by logistic or geopolitical challenges. Recently this amount increased above 60 days and is forecast to reach 65 days in 2016 – see chart below.
Storage capacity is limited and takes time to build up. There are reports of many oil-tankers storing instead of transporting oil. A good indicator for the preference of the market to store more oil is the future contract curve – see chart below. One year ago future prices were lower than spot prices (“Backwardation”) indicating a strong convenience yield for consumers who can not afford to run out of fuel and are willing to pay storage costs and interest yield instead. However today prices are at lower levels and the future curve has inverted to “Contango”. Now the spot price is almost 10% below future prices for next year. Since interest rates did not increase the storage costs must have risen.

Where does the extra supply come from?
The largest increase comes form North America. OPEC countries are also increasing their output. See chart for major production changes below.

Let’s take a look at biggest changes on country level.
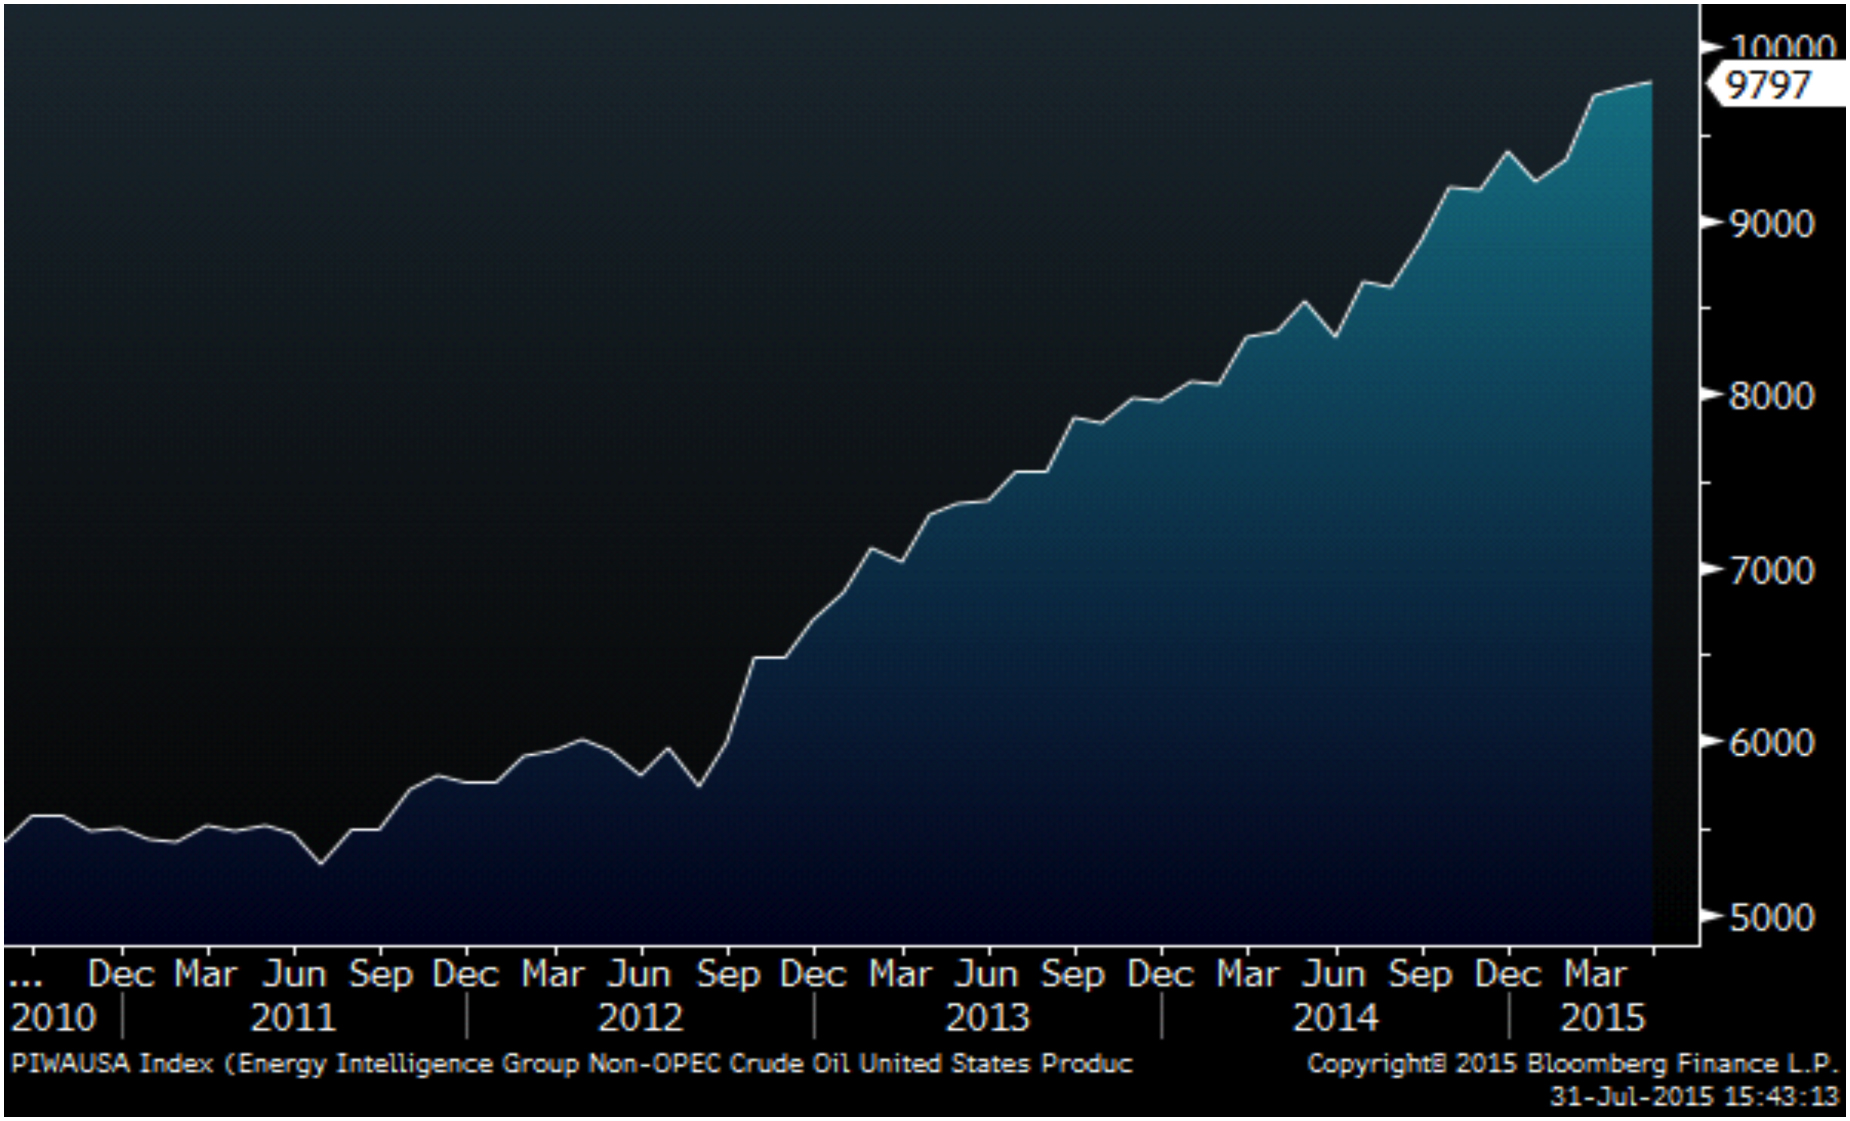
Surprise #1: USA
Crude oil output in the USA almost doubled to nearly 10 million barrels per day within just a few years. The largest consumer of the world will be the largest producer shortly. Accordingly they have already reduced their imports from OPEC by 50%.
This impressive development is based on the booming shale production called fracking. This method (“hydraulic fracturing”) forces fractures in a rock layer by fluid under pressure. This way huge amounts of previously out of reach oil and gas reserves become available.
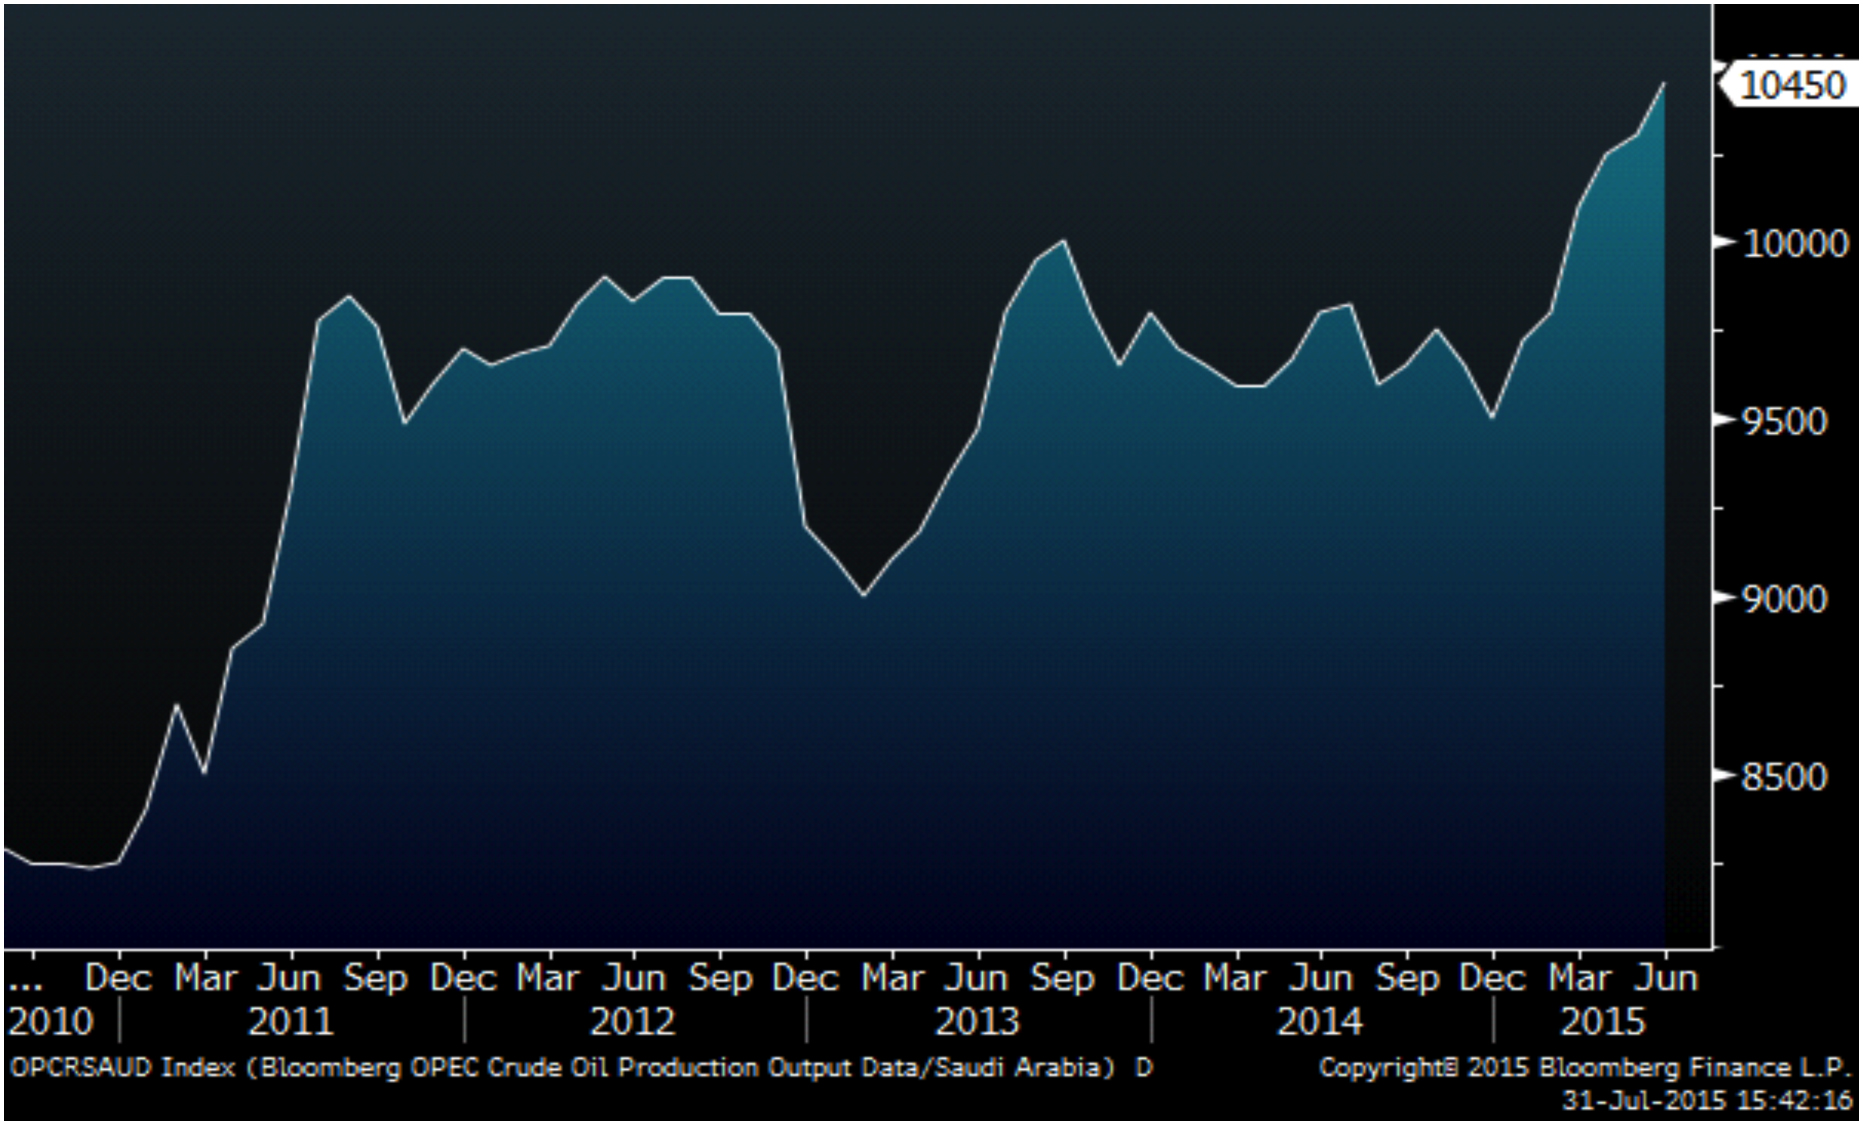
Surprise #2: Saudi Arabia
By contrast production innovation or costs have been no issue in Saudi Arabia. They have large reserves in terms of oil and financial assets. Oil production is very cheap. The largest producer of OPEC and of the world can take influence on global prices and does so to maximize its profit. Saudi Arabia could afford an output reduction to stabilize prices – unlike other countries like Russia or Venezuela that already suffer badly form reduced oil revenues.
However, this time Saudi Arabia is expanding production too – despite leading the OPEC that tries to maximize oil prices by curbing group production to 30 million barrels per day. This is quite a surprise for many analysts and sent oil price further down when announced. Obviously Saudi Arabia is trying to defend market share against frackers. It is hard to say at which price they leave the market. And it is hard to say how deep prices fall when Saudi Arabia opens the oil tab. They are simply testing the market right now. And they can afford to do so.
Surprise #3: Iraq
Iraq is probably the biggest phenomenon. It is the fourth-biggest supplier to world markets, has got huge reserves and production costs of just about USD 5 per barrel. The country suffers from war and terrorism and is split into the Kurdish region, areas controlled by Islamic State and those by Shiites. However about 90 percent of Iraq’s output is in the South controlled by Shiites and far from fighting. In this chaos the country has increased its production to new record levels – see chart below.

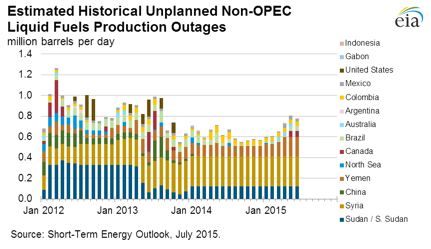
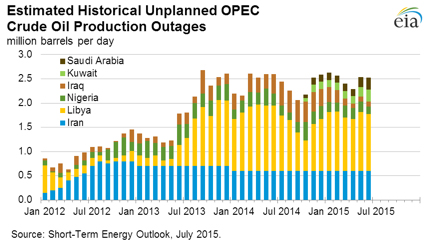
Unplanned outages
Beside these impressive supply increases there are still reserves in the market. Iran has been banned for years and is just about to return to the markets. Syria and Lybia suffer from civil war. If their production outages returned to the market simultaneously the current surplus would double. See charts below for OPEC and non-OPEC outages.
Summary and Outlook
The crude oil price has been falling considerably. The world crude oil market is experiencing a production surplus of almost 3%. While demand is growing at a fairly stable pace supply is growing even faster. Shale production is developing very fast and has been experiencing huge efficiency gains – mainly in USA. OPEC led by Saudi Arabia is fighting back by simply exporting more output causing prices to plunge. And there is more supply capacity in Iran, Syria, Lybia that is not being utilized yet due to sanctions and civil war.
Erwin Lasshofer and his INNOVATIS see the capability and a strong motivation of the biggest players to further increase their output. For now the game has changed. The OPEC cartel has lost some pricing power. In a trial to defend market share they utilize spare capacity to increase production. Thus oil prices have lost a strong source of support for the moment.
Furthermore fuel storage capacities appear to be exhausted. Thus the key question is at which price levels supply decreases and/or demand increases so far that production surplus drops to zero or even turns negative. The market is just looking for its new equilibrium. And the biggest players such as Saudi Arabia or USA will suffer less from the oil revenue loss than their geopolitical opponents such as Syria or Russia respectively – which appear to be a very welcome side effects.
Archives
- June 2019 (1)
- March 2019 (1)
- February 2019 (1)
- December 2018 (1)
- May 2018 (1)
- January 2018 (1)
- December 2017 (2)
- October 2017 (1)
- September 2017 (1)
- August 2017 (1)
- July 2017 (1)
- June 2017 (2)
- May 2017 (2)
- April 2017 (2)
- March 2017 (3)
- February 2017 (2)
- January 2017 (2)
- December 2016 (4)
- November 2016 (3)
- October 2016 (3)
- September 2016 (2)
- August 2016 (5)
- July 2016 (2)
- June 2016 (4)
- May 2016 (1)
- April 2016 (4)
- March 2016 (5)
- February 2016 (3)
- January 2016 (3)
- December 2015 (5)
- November 2015 (5)
- October 2015 (4)
- September 2015 (3)
- August 2015 (7)
- July 2015 (7)
- June 2015 (5)
- May 2015 (6)
- April 2015 (9)
- March 2015 (9)
- February 2015 (9)
- January 2015 (9)
- December 2014 (11)
- November 2014 (10)
- October 2014 (3)
- September 2014 (1)
- August 2014 (2)
- July 2014 (2)
Related Posts

An Interview with Erwin Lasshofer
By Erwin Lasshofer
Which products and services offers INNOVATIS? Erwin Lasshofer: The core business represents Asset Management. INNOVATIS cooperates with numerous reputable Custodian Banks. With INNOVATIS as accredited representative of the Custodian Banks the investor benefits from a customer-oriented account opening process. Moreover the investor takes advantage of special terms and conditions negotiated between INNOVATIS and the […]
READ MORE
INNOVATIS – the needs of our clients always take center stage
By Erwin Lasshofer
The needs of our clients always take center stage at INNOVATIS, therefore we are conducting a survey with a few quick questions. You will receive the sruvey when you contact us or when you subscribe for our newsletter. Please take a few seconds to mark your preferences. this way we want to make sure […]
READ MORE